

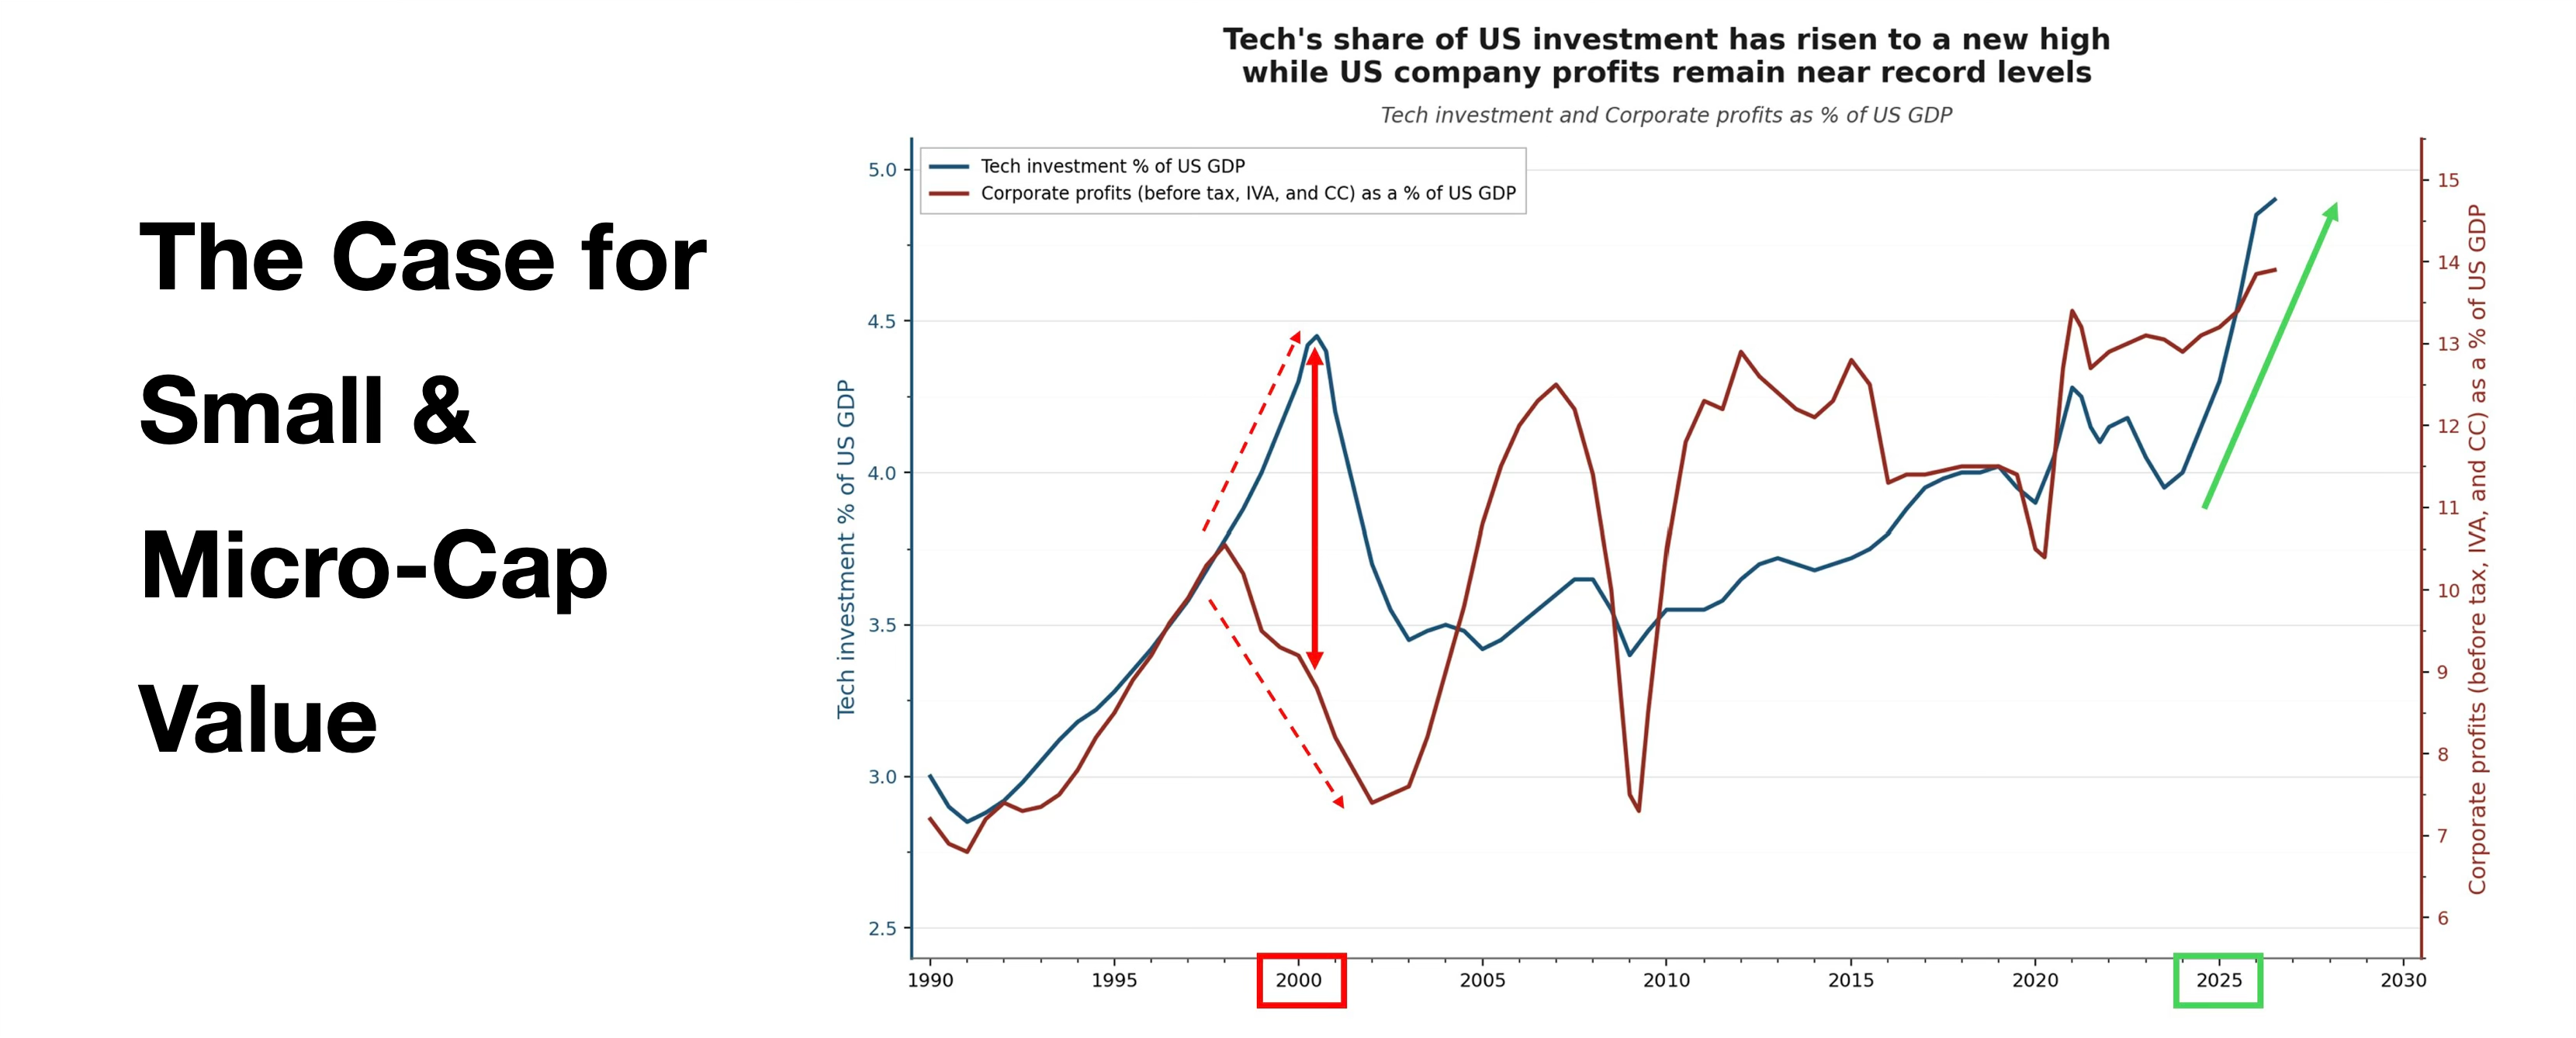
I noted that nearly every standard market-level valuation metric tracked, currently shows the US market at or near the most overvalued readings in their respective datasets. Shiller CAPE, Tobin’s Q, trend-deviation, and others.
However such historical ceilings aren’t hard limits.
Japan’s market reached roughly 100x earnings at its bubble peak, and China has also reached comparable extremes, meaning a US Shiller CAPE in the mid-40s is “not a magic number” that precludes further expansion.
Two Markets in One
The core observation is that today’s overvaluation is concentrated, closely echoing the dot-com top, when a small number of mega-cap growth names traded at extreme multiples alongside a much larger universe of reasonably or cheaply priced smaller companies.
This bifurcation can be tracked through two long-running ratios:
Equal-weight S&P 500 (RSP) vs. cap-weighted S&P 500: equal-weight has historically outperformed over the long run, except during large-cap growth booms (late 1990s, 2020, and 2024–2025), when the relationship reverses.
S&P 100 (largest 100 names) vs. S&P 500: tracks the same phenomenon from the opposite direction and shows a similar pattern across the dot-com era, 2020, and the recent cycle.
Both ratios have begun to turn back in favor of the broader, more equal-weighted market over the past several months, though with significant volatility, including a sharp reversal coinciding with the recent Iran conflict.
This is suggesting that the market hasn’t really picked a direction yet, but is closer to the ceiling of large-growth dominance than the floor.
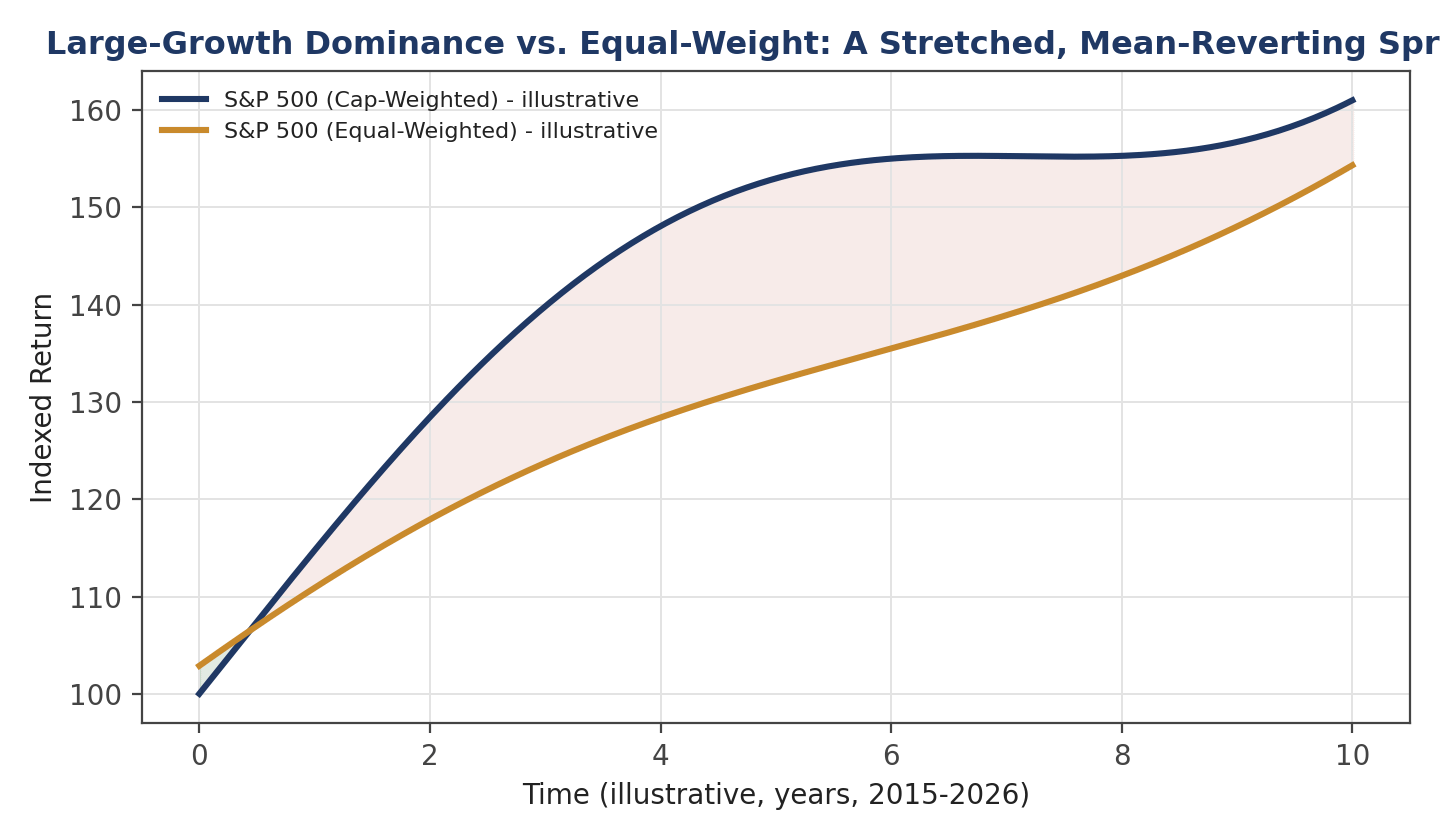
Illustrative depiction of the large-cap-growth vs. equal-weight performance cycle described by Carlisle, spanning roughly 2015 to the present.
How Wide Is the Value Spread?
Let’s look at some valuation-spread metrics (incorporating quality adjustments), the gap between the most expensive and most undervalued segments of the market currently sits around the:
90th–95th percentile when looking at value alone, and in the
85th–90th percentile range when quality is included.
These seemed to be comparable to the depths of the 2009 and 2020 drawdowns, even though the broader index has not experienced a comparable decline. This can be attributed to an underappreciated earnings recession in small- and mid-cap stocks from 2022 through late 2025, even as mega-cap earnings rose in a near-straight line over the same period.
Once the multiples get as stretched as they have for the Mag 7, it’s hard to see where else they can go. If you believe in mean reversion, then the smart bet is small and micro value, midcap value.
On AI, Productivity, and Who Captures the Value
The use of large language models personally has been eye-opening, analagous to having a fast, accurate, occasionally wrong junior analyst on call. I am skeptical that this necessarily translates into durable supernormal returns for today’s dominant AI model providers, for two reasons:
GPUs appear to depreciate functionally much faster (roughly 5–7 years) than prior infrastructure booms like fiber-optic cable or rail (multiple decades), and
it remains unclear whether one AI model will dominate versus multiple competing models converging in capability, which would compress returns to a more normal, competitive level.
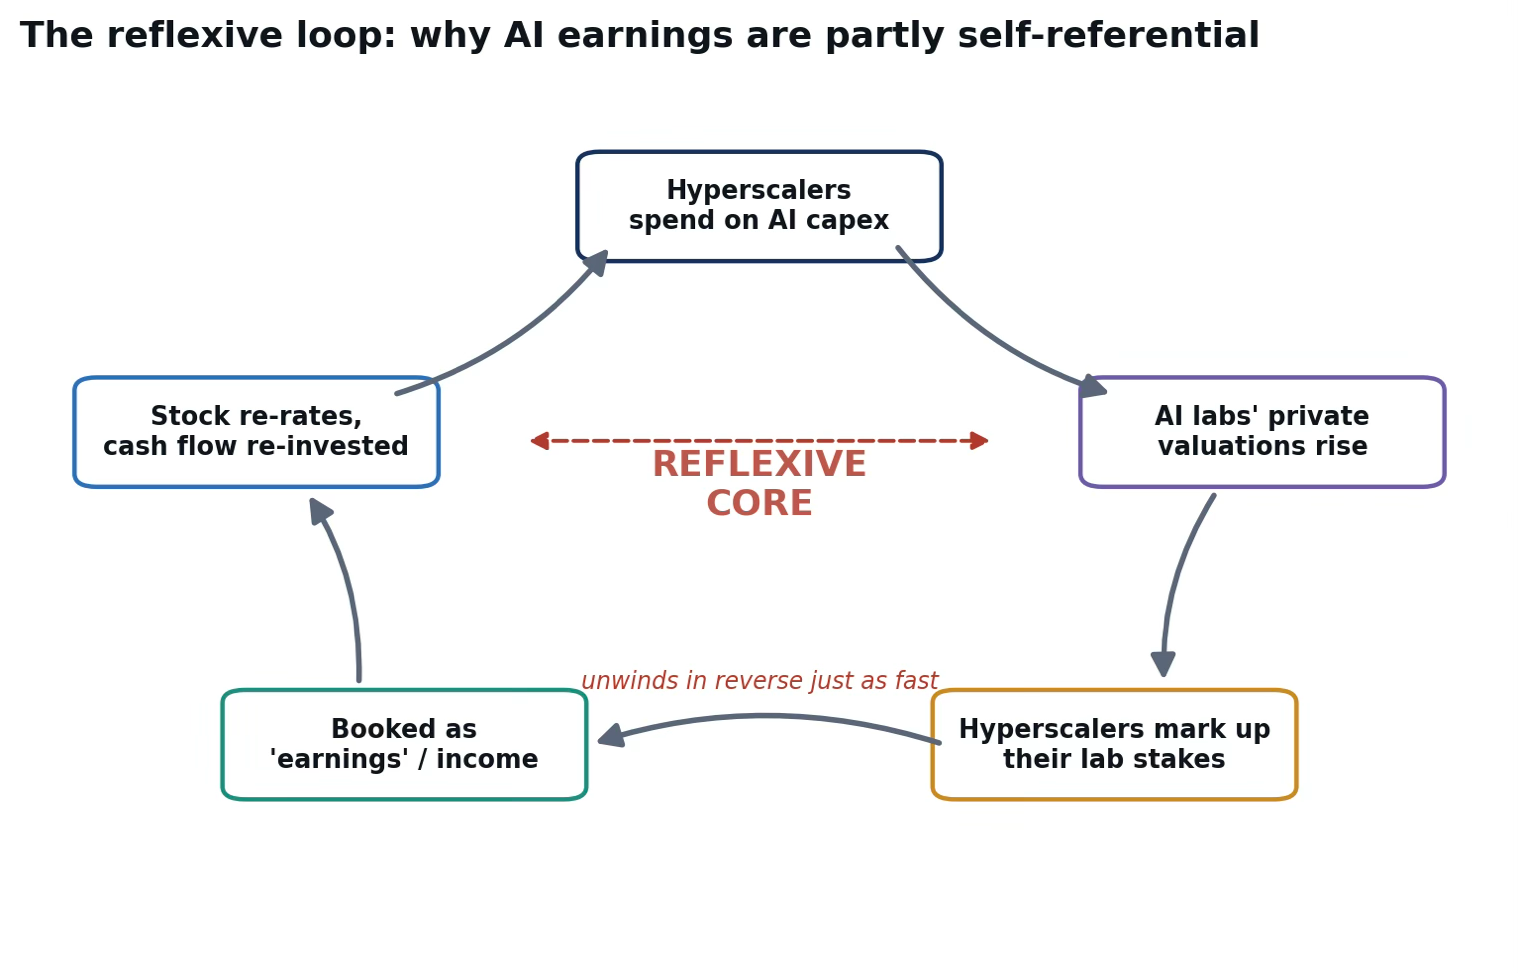
It’s also entirely conceivable that all of this work goes into creating these incredible AI models and all of the value accrues to the consumer and not to the people who create these models. I would then compare this dynamic to how having a website was a meaningful differentiator in 2000 but is now simply table stakes.
On Financing & Mega-Cap Valuations
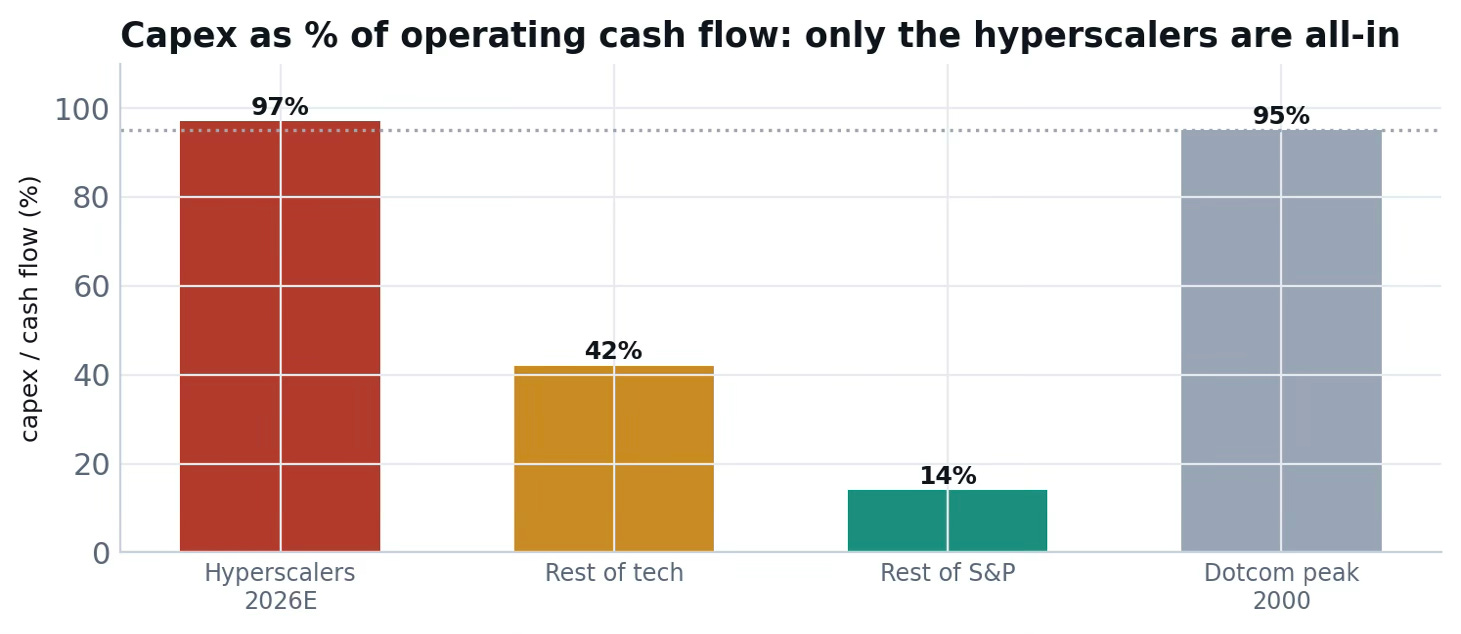
Though many would, but I do not subscribe to the idea that AI capex financing structure (cash flow vs. debt) is the key distinguishing feature of this cycle versus 2000. The dot-com top was also fundamentally a large-growth-multiple phenomenon spanning companies well outside pure tech, such as Walmart and GE being the old economy names that nonetheless carried extreme multiples at the time simply for being large and growing.
Some of today’s mega-cap valuations such as Apple at roughly 10x revenue, for instance, invite similar scrutiny to historical examples like Sun Microsystems’ Scott McNealy critique of paying 10x revenue without accounting for the full cost structure beneath it.
IPO Supply as a Cycle Signal
There is also unusual concentration of mega-IPOs in a single year. WIth such magnitude of recent and upcoming offerings is a classic late-cycle signal: when private-market sponsors offload growth assets to public markets en masse, it typically means the “marginal buyer” pool, public retail and institutional capital not previously exposed to the asset, has largely been exhausted, historically coinciding with cycle tops.
If we reference, the base-rate research (Michael Mauboussin’s growth-rate analysis) shows that some leading AI model companies’ growth has already exceeded what historical base rates would suggest as sustainable and a pattern he finds both remarkable and, by definition, unlikely to persist indefinitely
