


$PUMP as the scapegoat so Solana could fly

@solana printed $570 M revenue in Q2, taking 46% market share and most of volumes came from @pumpdotfun
$PUMP TGE is a net positive for Solana:
SOL activity comes from user engagement
Users enter with USD or stablecoins, then buy SOL to mint or trade meme coins.
They spend SOL in platform fees, trading, and gas — which drives real activity on-chain.
Attention + activity = future builders take notice.
Strong revenue = SOL becomes more investable as a consumer protocol.
It’s validation the chain’s economic engine works
TLDR
$500M raised in ~12 minutes during the $PUMP public sale, one of the fastest, largest community fundraises in crypto history.
KYC + geo-blocking (US/UK excluded) marks a surprising compliance turn for a memecoin launchpad historically associated with permissionless degens.
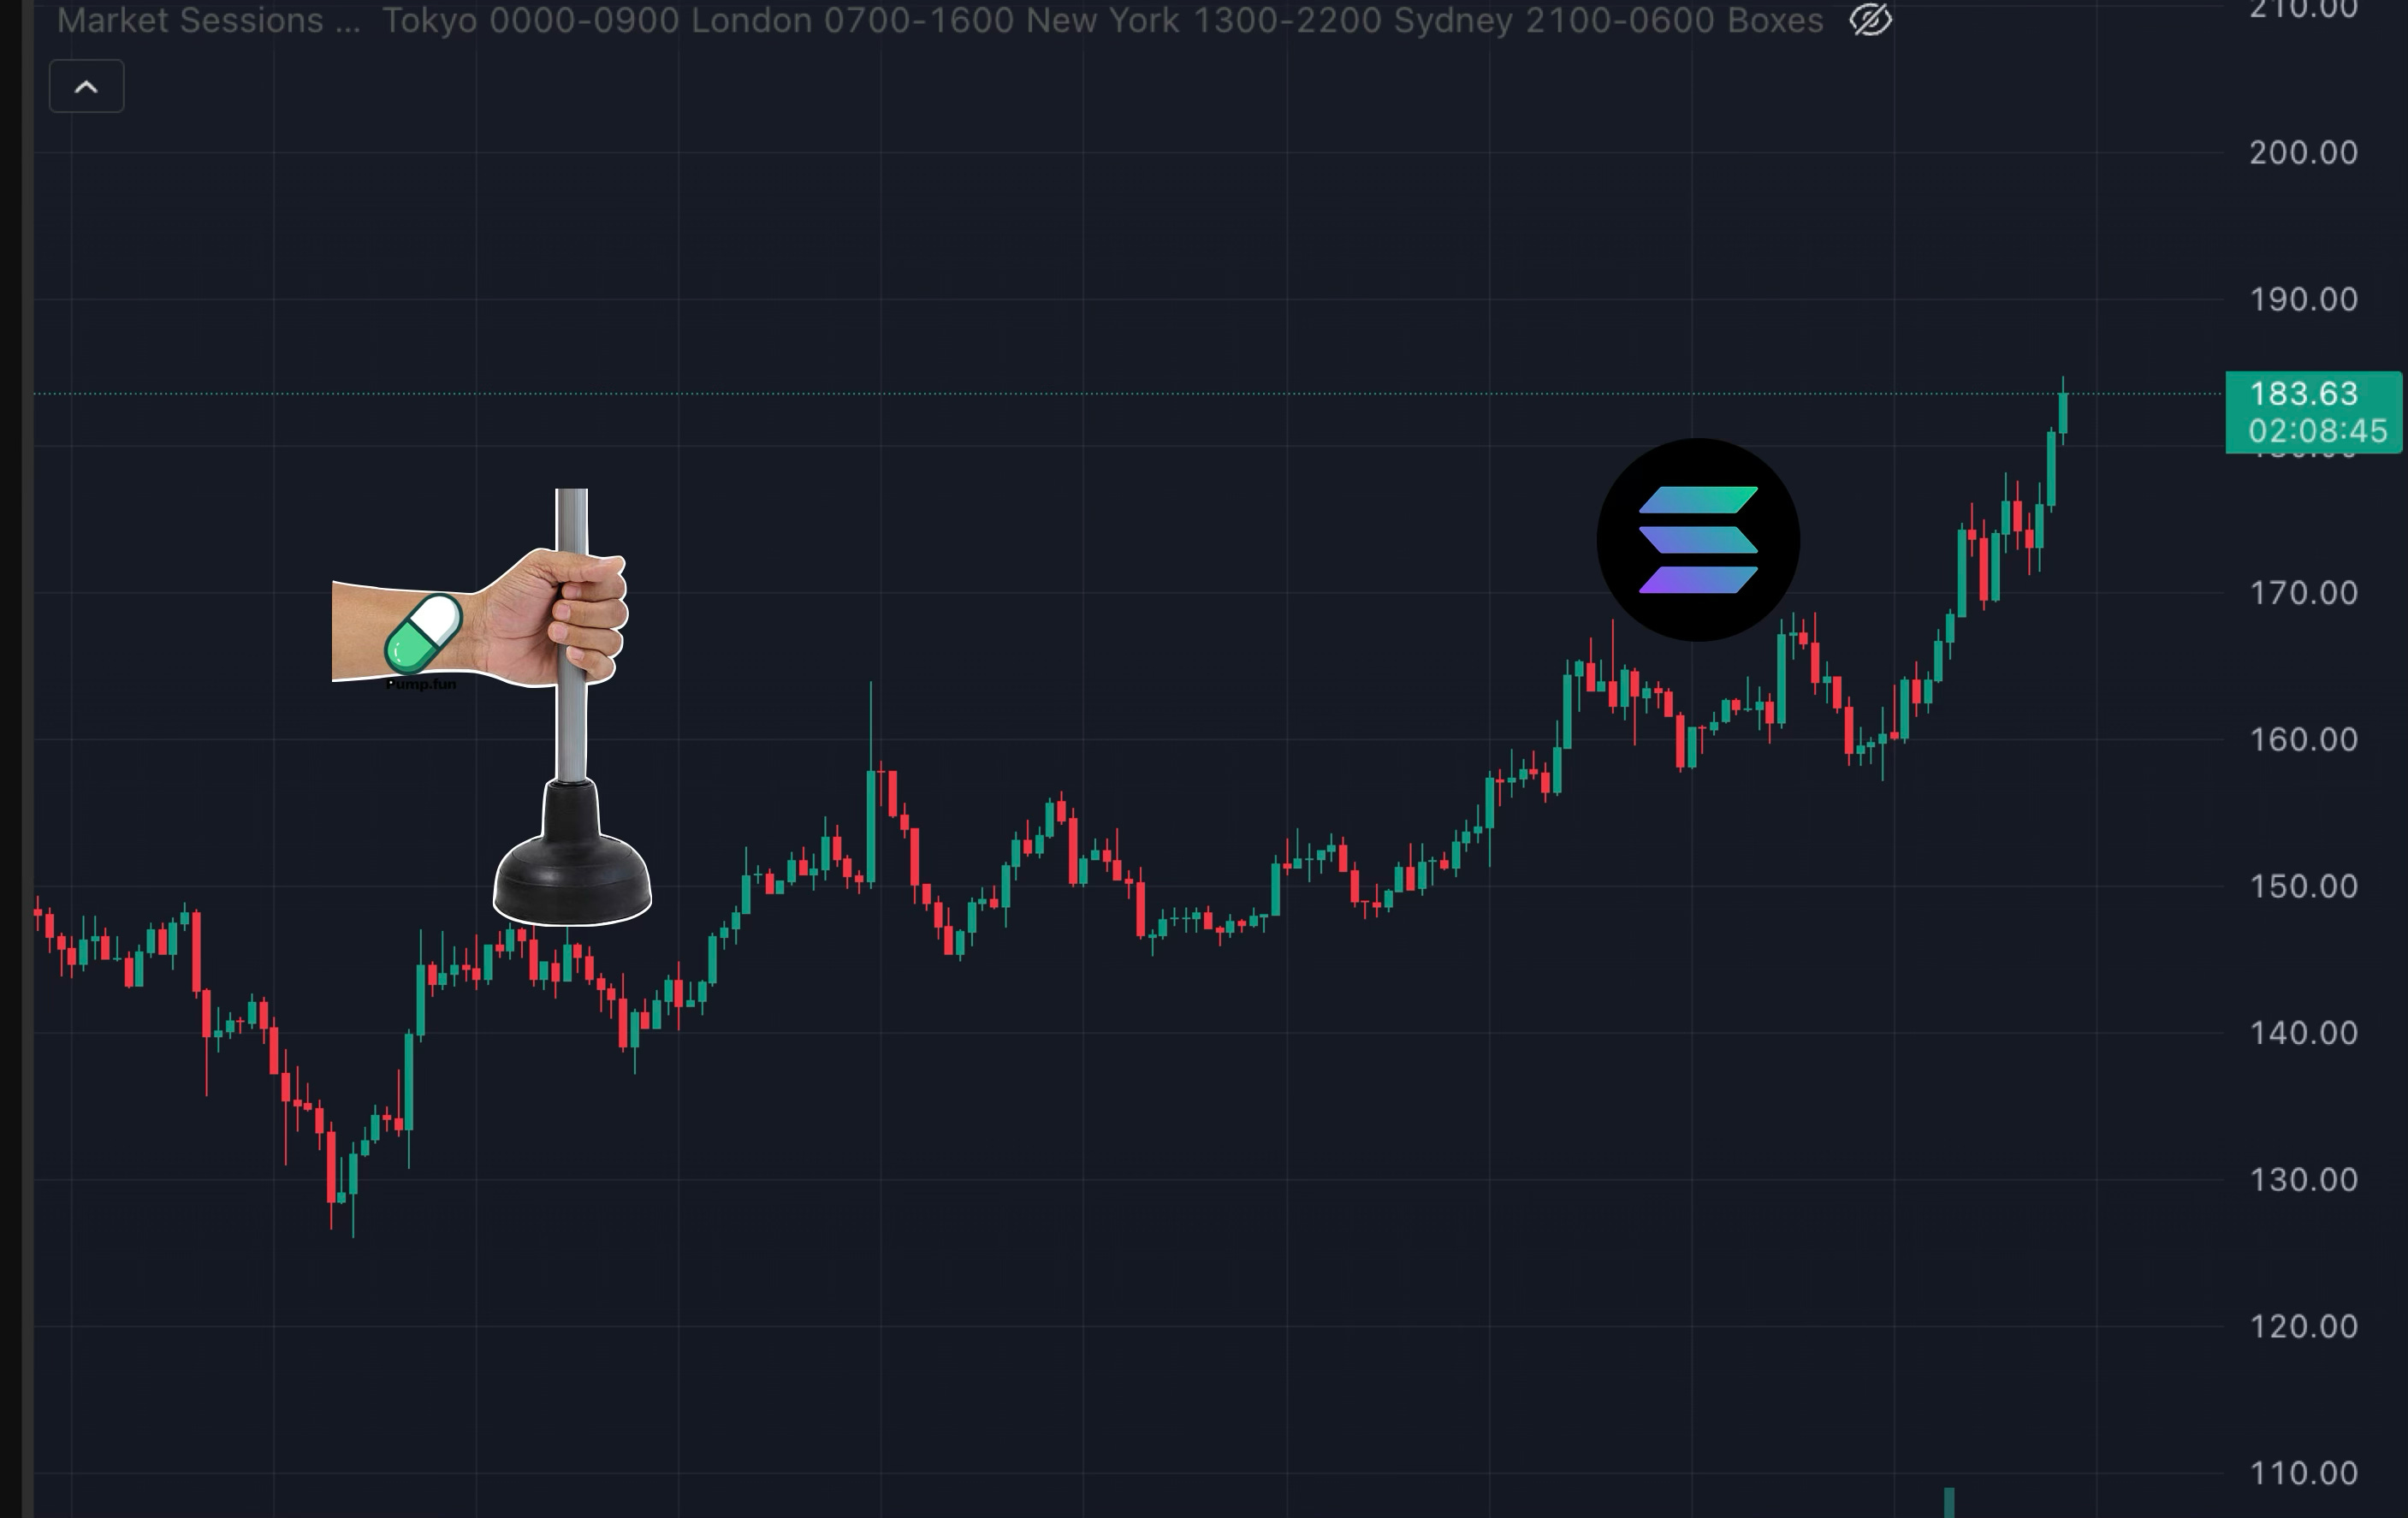
Initial listing pop held: Opened ~0.0056 (+40% vs ICO 0.004), wicked ~0.0065, then settled back near 0.0056 while funding stayed resilient / often positive despite large immediate float (~17%) and 50% paper gains for presale buyers.
Derivatives are hot: ~$750M open interest in perps — already ~#11 market-wide at launch window.
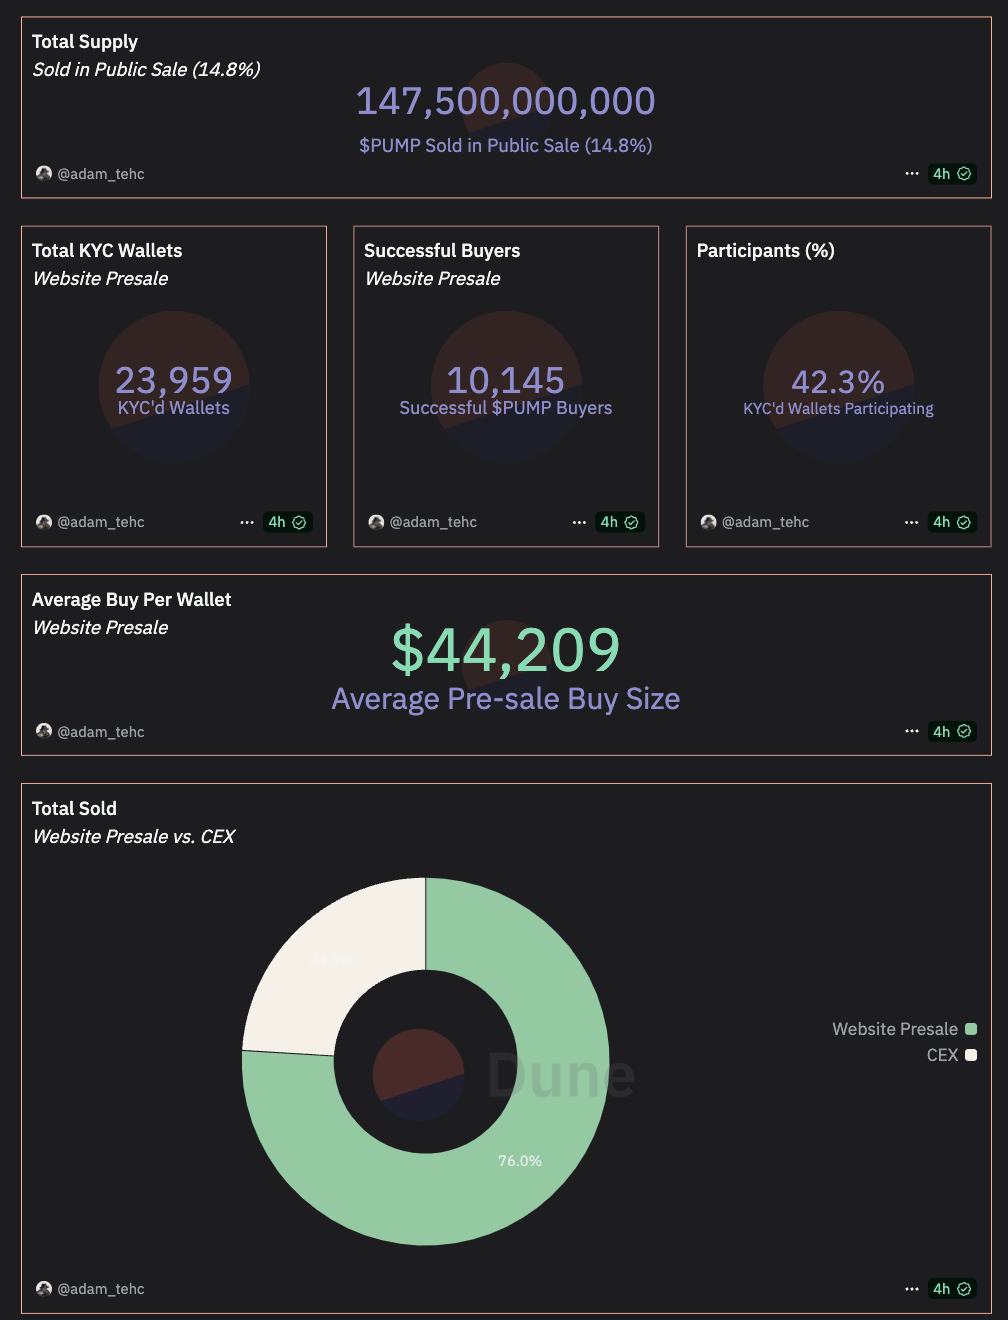
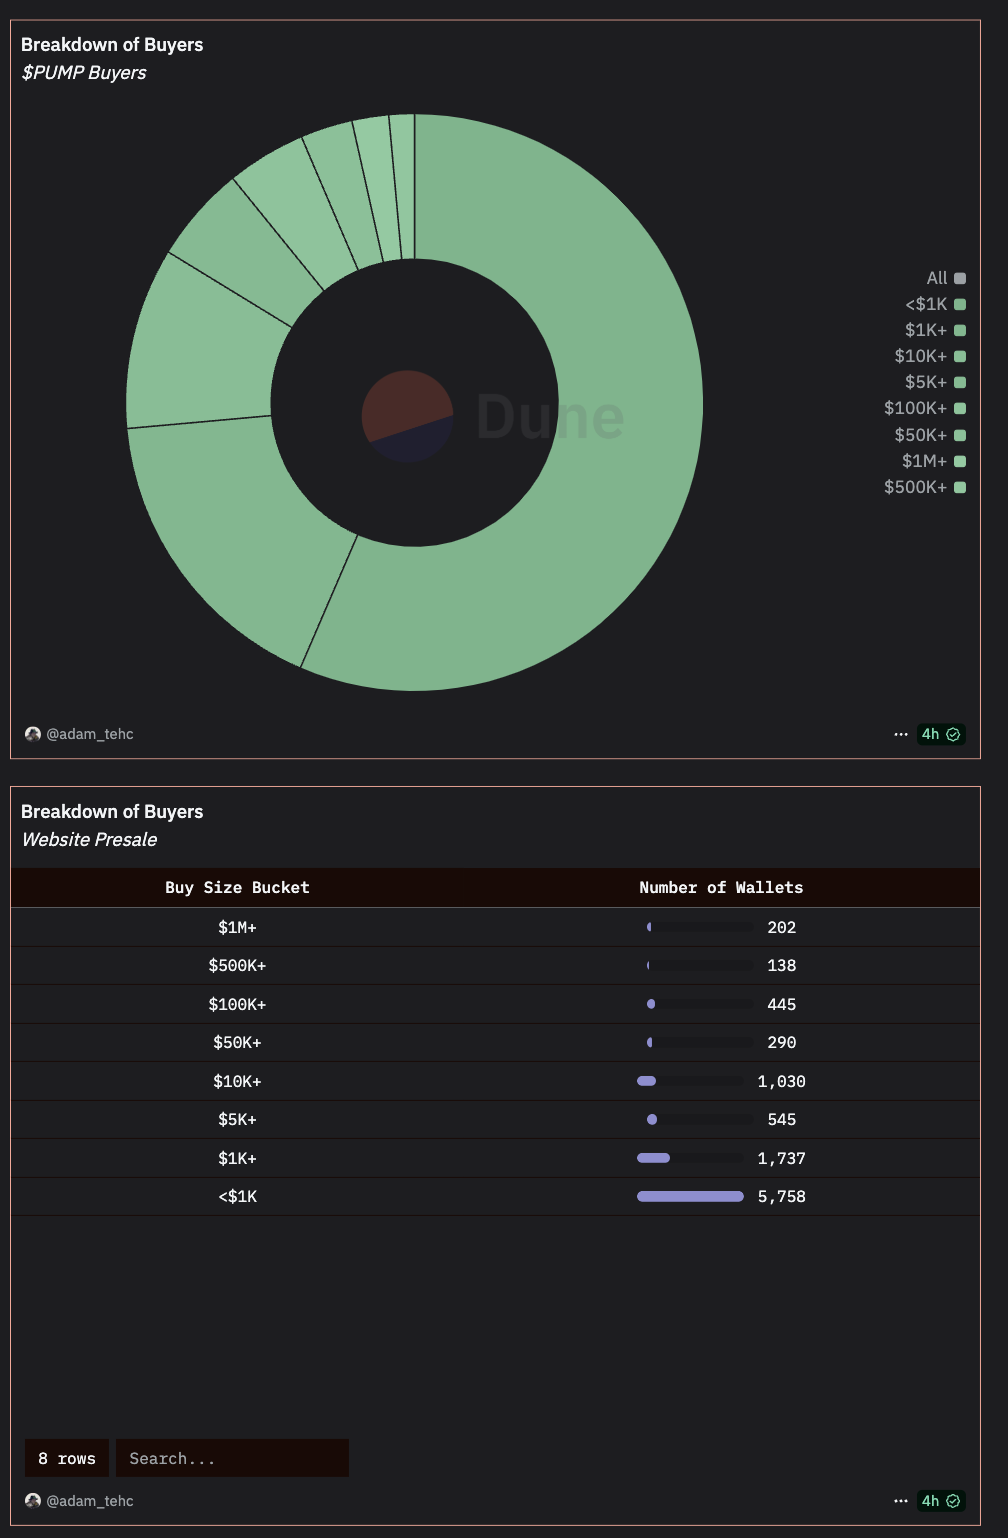
Distribution mixed but broad: 23,959 KYC’d; 10,145 wallets actually bought; whales skew dollar-weighted average ($44K mean vs ~$550 median). Still: 5,758 sub-$1K tickets shows genuine retail breadth.
Post-ICO wallet behavior: ~60% of presale wallets moved tokens (sold or to CEX), ~37% still holding, ~3% net added. Rotation without collapse = signal.
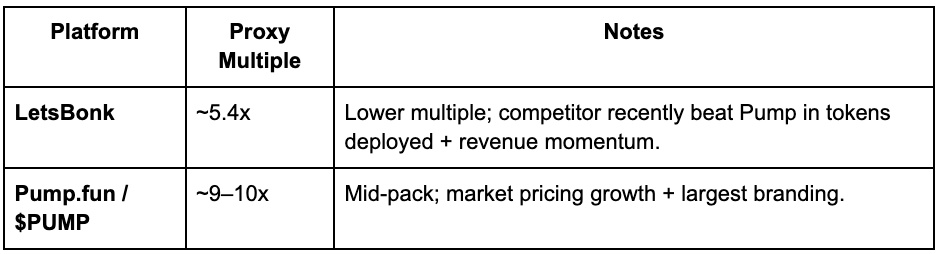
Platform economics: Pump.fun estimated ~$540M annual profit; at current FDV ~$5–6B, P/E ~9–10x — richer than LetsBonk (~5x) but way cheaper than Raydium (~65x). Implied $5.4K annual profit per DAU (100K DAU) — eye-watering, but beware whale skew + sustainability.
Headwind: Monthly volumes slid from ~$11.6B (Jan) to ~$3.65B (Jun). Trend direction now matters more than the headline raise.
1. What Pump.fun Actually Is (Beyond “Launch a Meme in Seconds”)
Pump.fun earned mindshare by removing the cost + contract complexity barriers that kept casual users from spinning up memecoins. One click → token minted, bonding curve booted, early trading live. That UX wedge bootstrapped an on-chain culture loop: jokes → tokens → volume → social clout → more creators.
The evolution path now matters for token value:
From launchpad to social trading layer. The roadmap positions Pump as the feed where you discover new memes, watch leaderboard flow, and stream market chaos.
Data + clout rails. Creator stats, velocity scores, and social embedding could give Pump a Bloomberg-for-memes feel.
Monetization: Fees across launches, volume routing, creator boosts, ad-like surfacing, content partnerships.
If $PUMP becomes the meta-asset riding those rails (fee share, staking, boosts, access tiers, TBD), its value will hinge on platform throughput + retention, not just one-time fundraising optics.
2. TGE Mechanics & Capital Flow Snapshot
Raise: ~$500M at $0.004/token for the sale tranche (~125B tokens sold). That math back-solves to a ~$4B FDV at sale price assuming ~1T total supply (used in most circulating estimates).
Immediate Float: ~17% unlocked at or soon after listing (sale + liquidity + early allocations).
Listings: BitMEX, Binance, Bybit, Kraken, KuCoin, Gate.io, others; both spot + perps came online quickly, enabling hedges and basis trades from day one.
Open Interest: ~$750M in perps, placing $PUMP roughly 11th among all perp markets at the time — huge liquidity signal.
Participation Data
KYC’d wallets: 23,959. Compliance gate filters out US/UK; ironically adds legitimacy + potential institutional comfort.
Successful buyers: 10,145 (42% of KYC’d). Demand > allocation; a hallmark of overheated token sales.
Avg buy: ~$44,209; median ~$550 → whale-skewed distribution but massive retail tail.
Ticket buckets: 202 wallets >$1M; 5,758 <$1K. Healthy spread across stack sizes; reduces single-cohort dump risk.
Where sold: ~76% via Pump.fun website presale; ~24% through CEX channels — shows community-first distribution with CEX as add-on liquidity, not gatekeeper.
Interpretation: Broad but competitive access, partial whale concentration, and explicit KYC — a strange but compelling combo that could rerate how regulators view meme infra.
3. Post-Listing Price Behavior: Why Didn’t It Nuke?
Classic playbook says: Big raise + big unlock + instant 50% paper gains = short it to Valhalla. Yet price opened 0.0056 (+40% vs ICO), wicked ~0.0065, and re-found ~0.0056 without the usual death-spiral.
Massive Buyback Scale Signals Strong Treasury Commitment
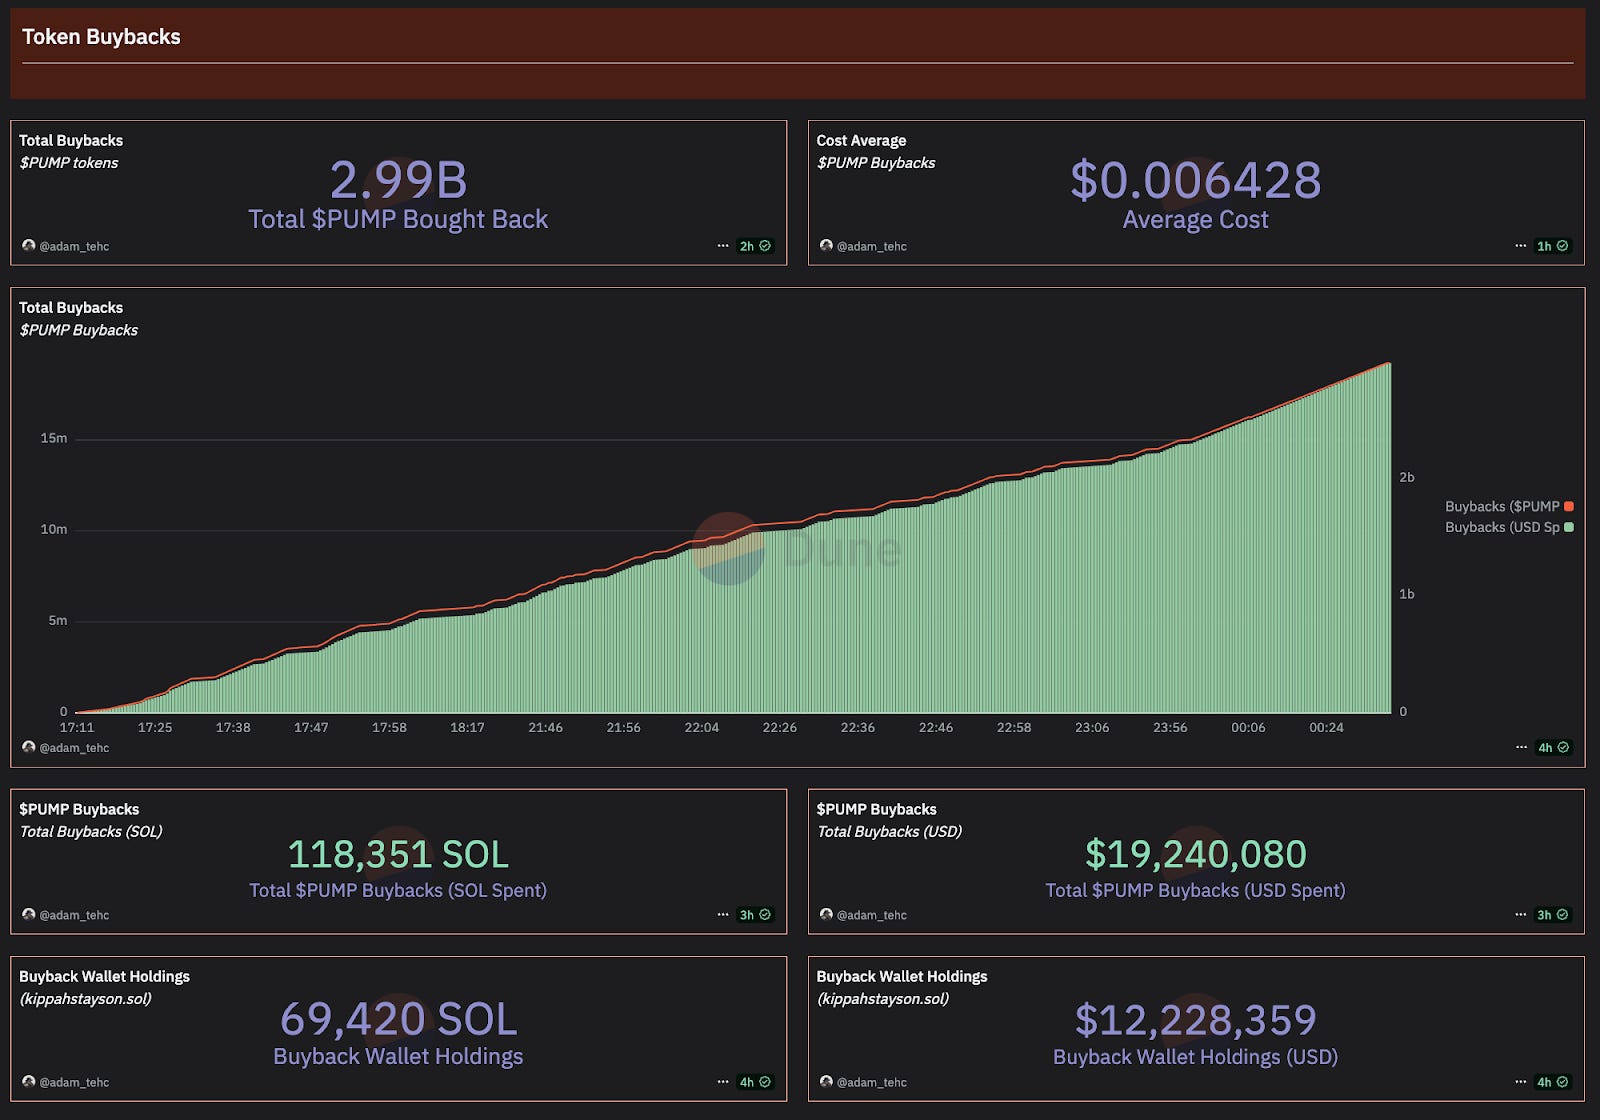
A total of 2.99B $PUMP tokens have been bought back, a significant reduction in circulating supply.
This represents a major capital deployment event, with $19.24M USD (or 118,351 SOL) already spent.
The average buyback cost is just $0.006428 per $PUMP, suggesting huge buybacks at near ATH.
Despite the impressive spend, ~$12.2M USD (or 69,420 SOL) remains in the wallet, nearly 40% of total reserves for future buybacks.
Indicates the buyback is ongoing and far from over, offering continued price support over the coming days or weeks.
This level of buy-side demand has likely soaked up significant sell pressure, creating a local price floor and reducing volatility.
The ongoing buyback program introduces a positive reflexivity loop, as confidence builds, the market may front-run future buybacks.
4. Wallet Behavior Deep Dive
From the 10,145 presale wallets (~$448.5M contributed):
6,042 wallets (59.6%) moved tokens to CEXs or new wallets (interpreted as sell, partial derisk, or trade prep).
3,791 wallets (37.4%) are still sitting on their allocation awaiting better terms.
312 wallets (3%) added to their stack post-sale.
6. Valuation: Is $PUMP Expensive?
Let’s frame the analysis using the datapoints flagged.
Quick Math
Using ~1T total supply:
FDV @ $0.0056 ≈ $5.6B.
If Pump.fun platform earns ~$540M annual profit, then P/E ≈ 10x (using FDV as rough equity proxy; yes, imperfect but directionally useful).
Peer Multiples (rough, directional)
Revenue Productivity Per User
100K daily active users cited.
~$540M profit / 100K DAU ≈ $5,400 profit per active user / yr. That’s absurdly high relative to most crypto apps and Web2 platforms.
Caution Flags
Mean ≠ median. Whale order flow + launch fees heavily skew top line; the median economic value per casual user is far lower.
Run-rate risk. Monthly volumes fell from ~$11.6B (Jan) → ~$3.65B (Jun). If that trend bleeds into 2H, the $540M profit run-rate could compress hard.
Sale optics vs operating reality. Raising $500M in 12 min shows strength; sustaining take-rate economics over declining volumes is harder.